
- One of the quiet challenges of pricing a home is recognizing when explanation has reached its limit.
- Understanding the Market Stages That Actually Matter
- A Slow-Market Scenario Made Visible
- A Hot-Market Scenario That Tells the Opposite Story
- Why Visual Proof Reduces Conflict in Pricing Conversations
- How Rebingy Makes Market Structure Instantly Visible
- Why This Matters for Both Sides of the Transaction
- Conclusion
Share
Pricing conversations rarely break down because of a lack of preparation. More often, they become difficult when the agent and the seller are visualizing two different versions of the market. This article explores why verbal explanations alone are often not enough and how visual market structure transforms the tone and outcome of a pricing discussion. By examining the four critical stages of inventory and how they interact across slower and faster-moving markets, agents can move from defending a number to interpreting a pattern, resulting in less friction, stronger trust, and more confident decision-making between agent and client.
Seeing the Market Clearly: Why Visual Proof Changes Pricing Conversations
Agents can be accurate, prepared, and thoughtful, yet still feel the conversation stalling. Not because the seller doubts their expertise, but because the seller and the agent are picturing two different markets in their heads.
The seller is imagining their home in relation to what they’ve seen online, what a neighbor received, or what they believe their property offers that others do not. The agent is thinking in terms of inventory, buyer behavior, and recent activity. Both perspectives feel reasonable, but they are not the same picture.
When those pictures don’t align, explaining the market verbally often creates more distance rather than clarity. What changes the conversation is not saying more, but showing more. That is where visual proof begins to matter.
When we talk about pricing, we often default to numbers in isolation. A sale here. A listing there. A comp from last quarter. But the market does not operate in pieces. It operates as a system.
What matters is not just what has sold, but what is available, what is moving, and what is stalled, all at the same time.
Every property in the market lives in one of four stages, and each stage tells a different part of the story.
- Active listings represent supply. They show how many options buyers have right now.
- Active under contract properties tell us that a buyer and seller have agreed on terms, but uncertainty still exists. Due diligence is underway, contingencies remain, and nothing is guaranteed.
- Pending listings reflect stronger conviction. Contingencies have been removed. Buyers have committed not just emotionally, but contractually.
- Sold properties complete the picture, but they are backward-looking. A sale reflects a decision made weeks or months ago, under conditions that may no longer exist.
The market’s truth lives in the relationship between these stages, not in any single one of them.
Let’s walk through a real example.
Imagine a home in Brentwood, ZIP code 90049, priced around $4,000,000. To understand how that price point is behaving, we look at a range within plus or minus 10 percent, roughly $3,600,000 to $4,500,000.
Now picture what the market shows you:
- 10 active listings
- 1 active under contract
- 1 pending
- 0 sold in the last 90 days
You do not need a spreadsheet to understand what this means.
There is inventory, but very little movement. Demand exists, but it is cautious. Buyers have leverage because options outweigh urgency. Even the most optimistic seller can see that this is a slower market once the data is laid out visually.
If you are a seller, this snapshot immediately reframes expectations. If you are a buyer, it signals opportunity and negotiating power.
Now flip the conditions.
Let’s say we are in Santa Monica, looking at homes around $2,500,000. Again, we examine a plus or minus 10 percent range.
This time, the picture looks very different:
- 4 active listings
- 3 active under contract
- 3 pending
- 6 sold in the last 90 days
This numeric relationship tells a vivid story. Inventory is tight. Properties are moving quickly through escrow. Sales are stacking. Demand is absorbing supply faster than it can be replaced.
If you are a seller entering this market, the numbers alone justify confidence. If you are a buyer, the message is equally clear. Expect competition. Expect multiple offers. Expect to pay over asking.
The power here is not the numbers themselves. It is how quickly they communicate market behavior when seen together.
When pricing is explained verbally, sellers often feel corrected.
When pricing is shown visually, sellers feel informed.
Visuals turn the market into a neutral third party. Instead of debating opinions, you are observing patterns together. This shifts the agent’s role from persuader to interpreter.
Conversation Cue:
“Let’s look at how homes in this range are actually moving right now. Once you see that flow, the pricing conversation usually answers itself.”
This is where resistance softens. An identifying moment to you, the agent, that the seller is understanding the market not being convinced by you.
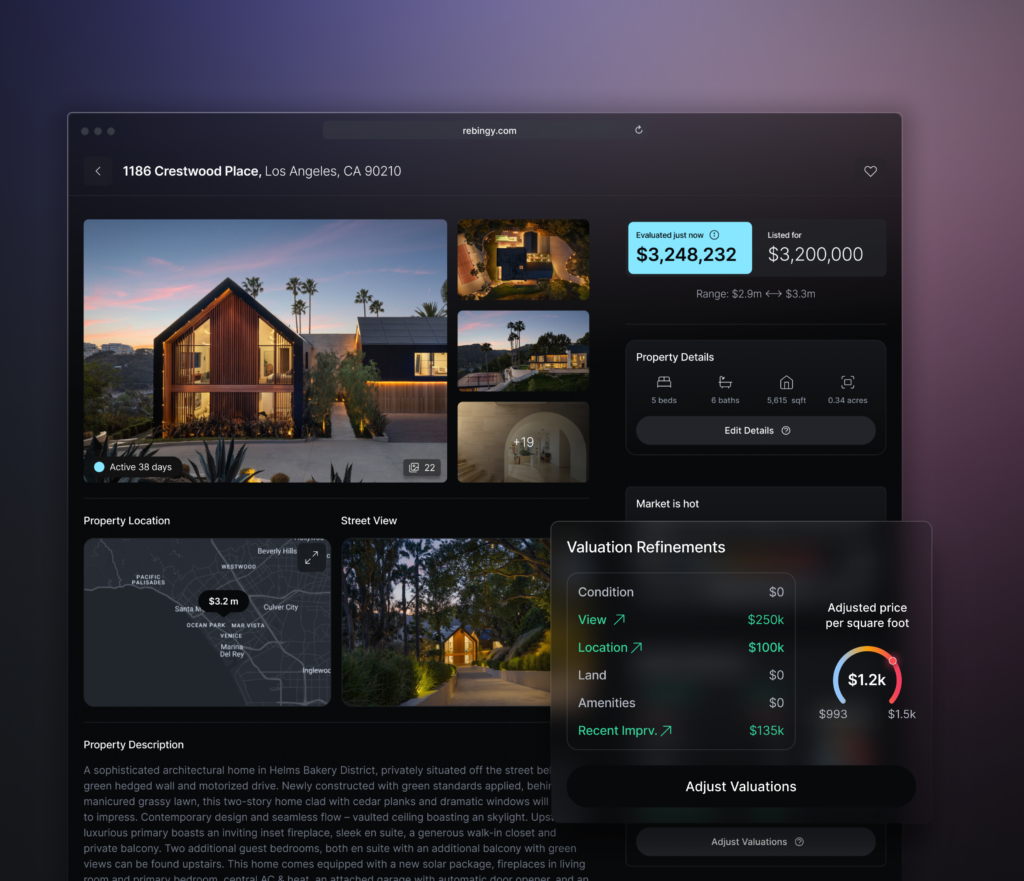
Rebingy was built around this exact moment.
In seconds, you can enter an address and see:
- a refined valuation and valuation range
- active listings in the immediate market
- properties active under contract
- pending sales showing buyer conviction
- sold properties from the last 90 days
- a heat map that visually connects all of it
The result is better presentations, better reasoning, and less tension between you and your client.
Instead of asking sellers to trust your interpretation, you invite them into it.
For sellers, visual proof removes fantasy without diminishing pride. It replaces uncertainty with understanding.
For buyers, it creates transparency around leverage, urgency, and competition.
Conclusion
Pricing conversations become difficult when agents rely on information being delivered without context.
When sellers can see how supply, demand, and velocity interact in real time, the market stops feeling personal and starts feeling predictable.
Rebingy exists to make that structure visible, so agents can lead with authority in pricing conversations.
The market is always speaking. Visual proof simply makes it easier to listen.
Related

What you’ll learn: Identify seller bias – Quantify pricing gaps – Replace opinion with market context – Prevent false alignment – Lead with valuation ranges – Protect leverage through strategy
8 min read
Repositioning a Stale Listing

What you’ll learn: Identify loss of market momentum – Review pricing and comps – Rebuild narrative – Reset expectations – Relaunch strategically